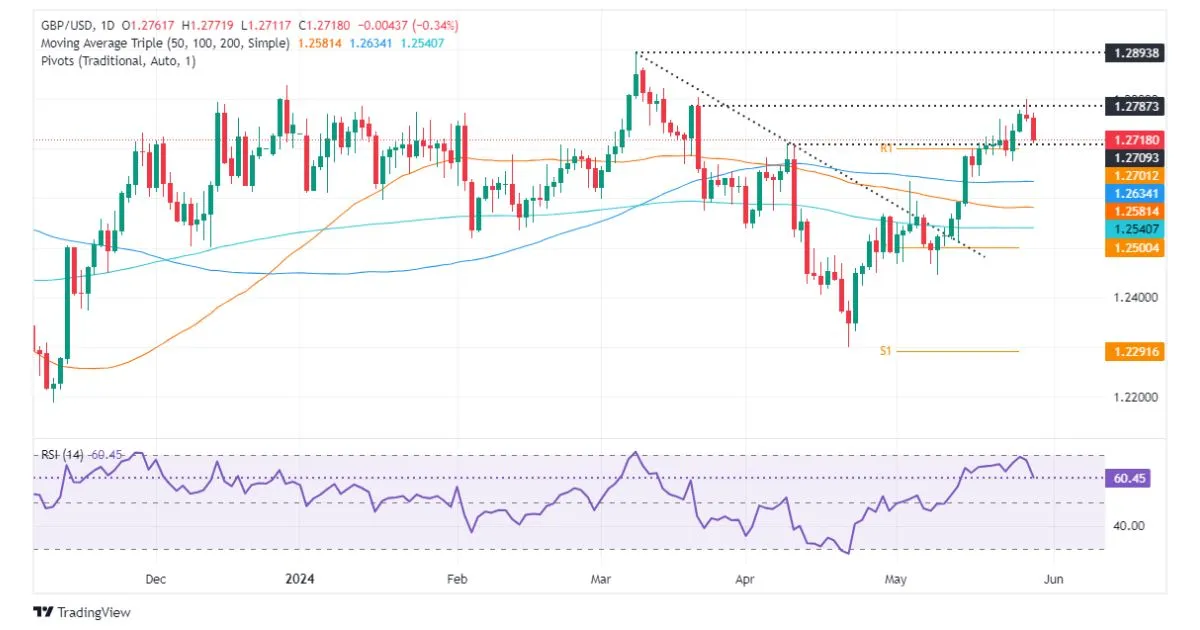
- GBP/USD has hit a new three-day low as the ‘Evening Star’ chart pattern has emerged.
- Buyers’ momentum is starting to fade as the RSI is heading towards the 50-midline.
- If the pair drops below 1.2700, expect further losses ahead; otherwise, bulls may challenge 1.2800.
The once mighty British Pound took a sharp dive against its American counterpart on Wednesday, hitting a new low for the week. This plunge was fueled by the relentless rise of US Treasury bond yields, sending shockwaves through the currency market.
Adding to the tension, Federal Reserve officials maintained a cautious stance, causing traders to reassess their predictions of potential rate cuts. As a result, the GBP/USD pair tumbled to 1.2719, marking a significant 0.33% decrease.
GBP/USD Price Analysis: Technical outlook
The GBP/USD chart is revealing a dramatic three-candle pattern known as the ‘evening star,’ signaling a potential drop in prices. While the Relative Strength Index (RSI) shows a bullish trend, it’s inching closer to the 50-midline, indicating a weakening of buyer power.
As the British pound continues to struggle, all eyes are on the GBP/USD pair and its potential to drop below the critical level of 1.2700. If this happens, brace yourself for a thrilling ride as the pair could potentially test the May 3 daily high, now turned into a formidable support at 1.2634.
Exclusive: Why has Bitcoin stalled after a bullish run?
South Korea under pressure to adopt crypto ETF after US
First Bitcoin ETF, now Ethereum ETF, next SOL, XRP whose?
The excitement doesn’t stop there. The next support to watch out for is the 50-day moving average (DMA) at 1.2580, followed closely by the 200-DMA at 1.2539. On the flip side, if the bulls manage to reclaim the current week’s high of 1.2777, we could see a surge in buying pressure propelling the pair towards further gains above 1.2800.
Disclaimer: This article is provided for informational purposes only. It is not offered or intended to be used as legal, tax, investment, financial, or other advice.
